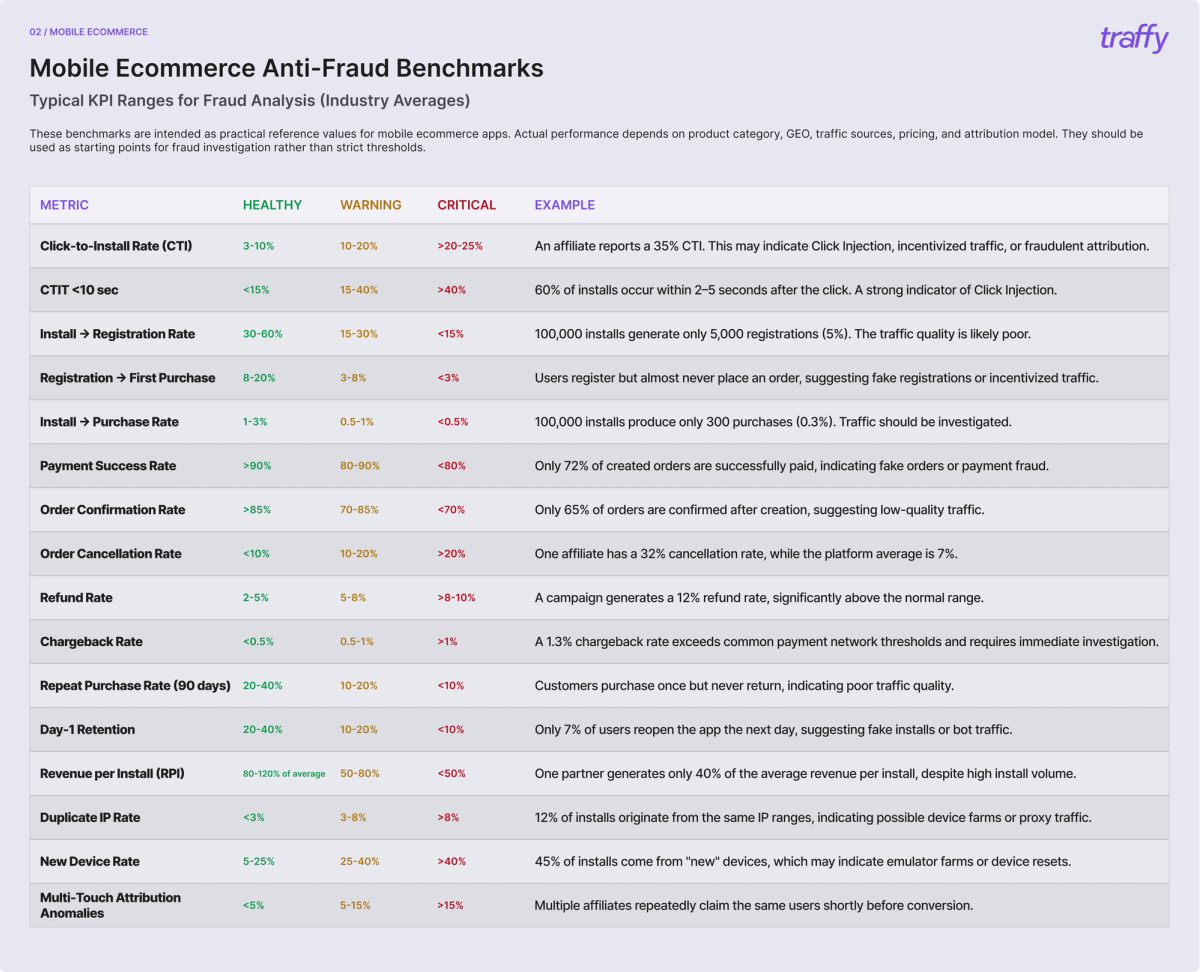
Typical KPI Ranges for Fraud Analysis (Industry Averages)
These benchmarks are intended as practical reference values for mobile ecommerce apps. Actual performance depends on product category, GEO, traffic sources, pricing, and attribution model. They should be used as starting points for fraud investigation rather than strict thresholds.
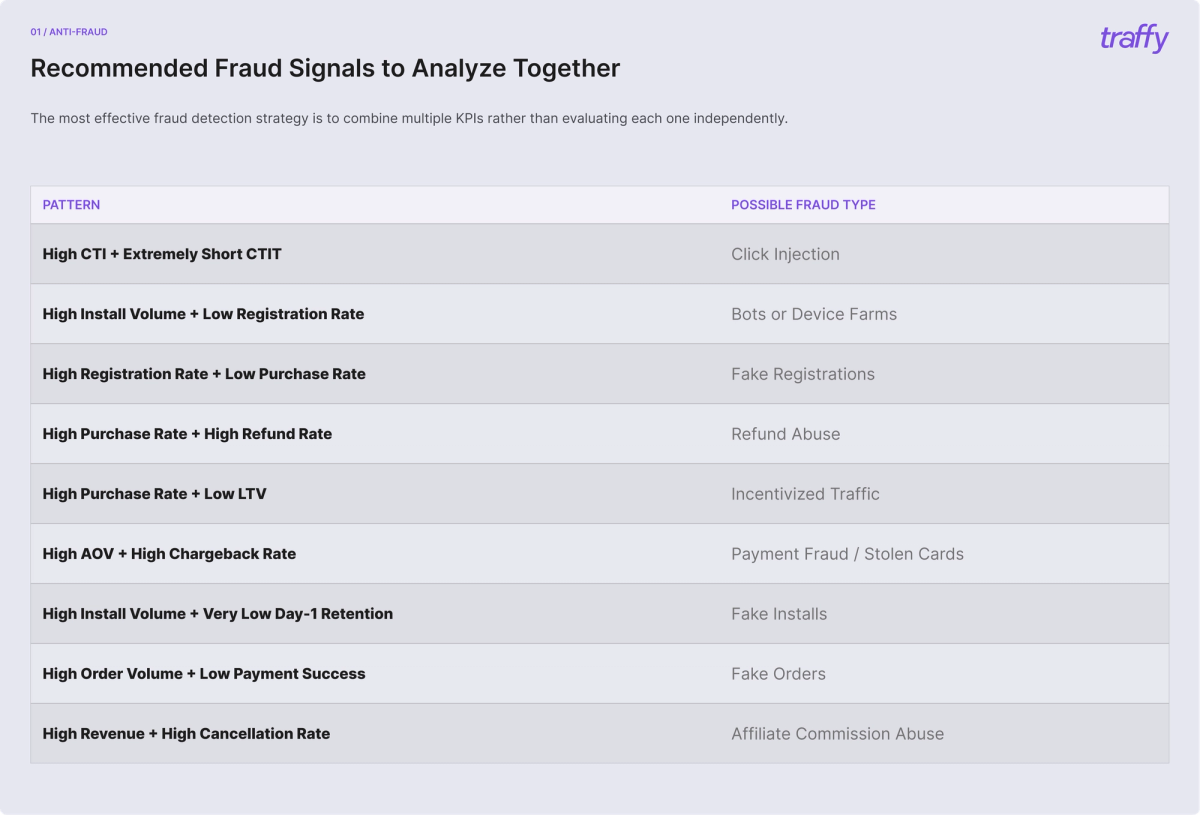
Quick Fraud Examples
Real-world patterns that signal invalid or fraudulent traffic — and the numbers that give them away.
Click Spam 1,000,000 clicks → 8,000 installs (0.8% CTI) Most installs occur several days after the click — a strong sign of large-scale click flooding.
Click Injection 55% of installs have a CTIT under 5 seconds. This timing is nearly impossible for genuine users and strongly points to click injection.
Fake Installs 50,000 installs → 500 registrations (1%) High install volume with almost no engagement is a classic sign of bot traffic or install farms.
Fake Orders 2,000 orders created → 1,200 successfully paid (60%) A large share of orders is abandoned or created intentionally to trigger affiliate commissions.
Refund Fraud Platform average refund rate: 3% · Affiliate X: 14% This partner's users consistently return products after commissions have already been paid.
Affiliate Fraud Platform average order value: $120 · Affiliate traffic: $28 An unusually low basket size combined with high conversion volume suggests incentivized or low-quality traffic.
Bot Traffic
- 90% of users open the app only once
- Session duration under 5 seconds
- No product pages viewed
- No checkout activity
This behavioral pattern is highly characteristic of automated bot traffic.
Recommended Anti-Fraud Dashboard for Mobile Ecommerce
For most mobile ecommerce applications, the core fraud monitoring dashboard should include:
- Click-to-Install Time (CTIT)
- Click-to-Install Rate (CTI)
- Install → Registration Rate
- Registration → Purchase Rate
- Payment Success Rate
- Order Confirmation Rate
- Cancellation Rate
- Refund Rate
- Chargeback Rate
- Repeat Purchase Rate
- Revenue per Install (RPI)
- Customer Lifetime Value (LTV)
- Average Order Value (AOV)
- Device Reputation
- IP Reputation
- Duplicate Device Rate
- Event Sequence Validation (SDK vs. Backend)
Monitoring these metrics together provides a comprehensive view of traffic quality and helps identify fraud at every stage of the mobile ecommerce customer journey — from the first ad click to the final delivered order and partner commission payout.
Not sure where your own traffic stands? Traffy runs free fraud audits for e-commerce apps. We'll benchmark your GEOs, sources and funnel against these ranges and show you exactly where budget is leaking — before you spend more on it. Leave a request on the Traffy website to book your free audit.